Heart Rate analysis: Non Specific Response (NSR).
|
Heart Rate analysis: Non Specific Response (NSR). |
|
Heart Rate (HR) changes while studying emotion; HR effects during task trials relative to baseline; general background HR variation. Preamble |
 |
|
PSYLAB records Heart Rate (HR) as the interval between successive heart beats (I.B.I.). IBI is inversely related to HR by the equation HR = 60000 / IBI. The PSYLAB Interval Timer resonds directly to the electrical signal produced by EKG or the Peripheral Pulse amplifier. It has an internal clock which increases in one millisecond intervals. Each time a heart beat occurs, a self-adjusting circuit in the Interval Timer converts the electrical shape of the heart wave into a discrete 'trigger'.
Interval timer. |
|
|
|||||||||||||
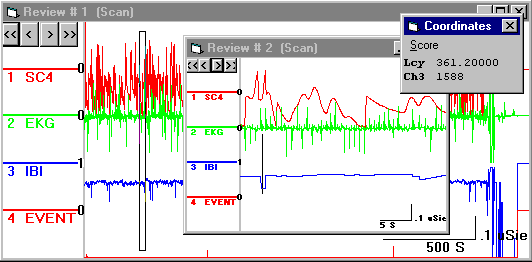
This trigger is used first to take the reading of the clock (which is transferred to a temporary electronic memory or buffer) and then it re-starts the clock at zero. If the measurement program includes a line ' $measure ibi', the measurement system will take readings from the Interval Timer at the same rate that it takes readings from the A-D converter to represent other 'analog' signals (in this example these are SC4 Skin Conductance and EKG, the heart wave-form). PSYLAB windows processing system has two functions relevant to analysis of Heart Rate: the MEAN function and a feature which allows rejection of values from the Interval Timer in the MEAN calculation if they lie outside a given range. MEAN function: IBI range settings. The record used here to demonstrate Heart Rate analysis was generated in a study in which there were baseline and various 'active' stages. Each stage was designated by pressing a function key. A typical entire recording is shown below, with a small section Zoomed in upon, by drawing a rectangle round the required section (hold down the right mouse button and drag from the top left, then double click the left mouse button and select Zoom in). In that section, there can be seen an I.B.I. artefact (a cursor is dragged across the axis of the blue channel, showing the readout from that channel in the Co-ordinates panel; most of the readings from that channel are in the region 700 to 900 mS (heart rate of about 70 BPM), but at the point where the cursor is shown, the values read out at 1588 mS, indicating that the Interval Timer failed to trigger on one beat, and thus recorded the double interval of two beats). The analysis demonstrated here allows correction for such bad triggering. Note that the EKG channel shows a poor representation of typical cardiac waves, because the computer log sample rate used is only 20 per second, insufficient to reliably register the amplitude of the R wave, which has short time characteristics. However, this does not affect the accuracy of Inter-Beat-Interval timing, as the Interval Timer will register the full amplitude of the R wave the instant it occurs causing it to begin a timing cycle, with resolution of 1mS. Summary Data were recorded in the 'general' experiment to study physiological variations during different stages which were indicated by pressing different function keys on the computer keyboard at the beginning of each stage. At certain times Heart Rate data (represented in the record as Inter-Beat-Interval) had artefacts owing to bad triggering of the rate meter (Interval Timer). An analysis was performed to take an average of the heart rate in a series of thirty second time epochs, synchronised with each key press. Where artefacts were detected, bad values were omitted from the average calculation. A table of results was produced showing the analysed Heart Rate data with each 30 second period represented on a separate line in the table. An additional field of data was produced to indicate the number of bad values in each time epoch, to be used a an indication of data validity in subsequent processing. Other information, such as the subject number and the category of each event (which key was pressed to indicate the event) was included in every line of the results table. This produced a disk text file of user-defined format suitable for direct import to spreadsheet or statistical analysis programs to permit comparison and grouping of results across subjects. The entire analysis process was registered as a macro program which allowed subsequent records to be automatically analysed in the same way. Method PSYLAB windows software was operated manually with 'macro record' switched on to record each function used in analysis of a typical data record so that subsequent records could then be automatically analysed by simply runing the macro. Each stage in the manual analysis generated a line of macro code which could be seen in the Macro window. If a mistake was made while manually performing the original analysis, incorrect lines in the macro window could be directly edited. The computer was configured to run Windows 3.1 or Windows 95 with a screen resolution of at least 600x800 to allow room for the different visual panels which PSYLAB would create. PSYLAB6 was started so that the toolbar was seen. It was positioned at the top left of the screen. |
 |
||||
Please refer to http://ourworld.compuserve.com/homepages/PSYLAB for the rest of this document |
||||
The macro window was opened by clicking on the fourth button on the toolbar. It was positioned at the bottom right of the screen. 'Record' in the macro window was clicked to activate record mode. The third button on the toolbar, 'open data', was then clicked and a raw data file was selected from the file selection panel. This caused the first line ' OpenRawData' to be generated in the macro window. |
 |
At this point, if the macro was run this line would automatically present the raw data file selection panel to the operator prompting them to choose an experiment record, which is the first step of the analysis. (The first line in the macro could alternatively have been created by selecting Toolbar menu, File Data, Batch open data, generating an line like ' OpenRawData@FILENAME.BCH'. This would have allowed raw data records to be read in from a list of file names, so that a batch of records could be processed without operator intervention). Opening raw data caused the entire record to be seen in Review#1. The amount of detail seen in this Review was dependent upon the setting found in Toolbar menu, Options, Initial display density setting. In the example data shown here, Density was set at 2500, meaning that the Review resolves the time scale into 2500 parts. It is just possible to see the brief events in the bottom channel at this resolution. With raw data showing in Review#1, the mouse pointer was positioned on the body of this Review and the left button double-clicked to obtain the Review menu. Set blocks was selected, causing the Block selection panel to appear.
|
Block settings chosen were: Set block time width: 30 Set pre-event interval: 0 Set event levels to detect: 1 to 255 Set number of blocks per event: 10 |
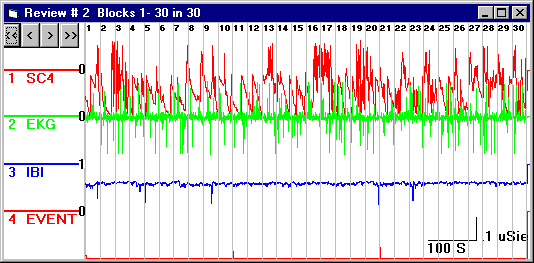
The event channel automatically selected at channel 4, which was the correct channel. This would have varied if the number of channels in the record had been different. Detect events on onset was checked, the other three options were not checked. The settings were then saved to file, using File, Save settings as. from the Block selection panel menu. The file name used in this example was SMITH1. PSYLAB automatically added the extension .BLO The 'View blocks' button on the Block selection panel was then clicked, causing PSYLAB to scan through the record looking at every point in the event channel too detect changes where the level encountered was within the range 1 to 255. PSYLAB then created a new Review#2, which contained multiple blocks (10 blocks for each of the 3 event markers, a total of 30 blocks). This also caused the line ' SetBlocks@C:\CPI\SMITH1.BLO' to be registered in the macro window, which would allow an identical block pattern to be created if the macro was subsequently used to automatically process other similar records. |
 |
The process channel indicators to the left of each channel were then set so that only the I.B.I. channel (3) was selected (showing as 1). The Review menu was then obtained on the multi-block Review (by double clicking in the body of the Review). Process, Set Parameters was selected. This opened the Process settings window. The panel of interest in this case was 'Select Mean Parameters'. Details of this are found lower in the body of the process settings panel page. |
|
|
|||||||||||||||
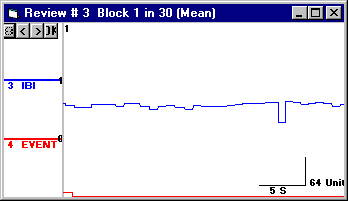
These settings were saved using File, Save process settings as. in the Process Settings window menu. File name SMITH1.PRO was used (the extension .PRO was added automatically). The Process Settings window was then closed. This caused the line: Review#2, Process@C:\CPI\SMITH1.PRO to be registered in the macro, which would allow identical Process Settings and channel selection to be loaded if the macro was subsequently used to automatically process other similar records. The Review menu was again obtained on the multi-block Review (by double clicking in the body of the Review). Process, Mean. was selected. This caused Review#3 to be produced, showing the first block of 30 in full detail, with only the selected I.B.I. channel showing (the event channel may also have shown, if this was selected on the Process Settings panel, but it would not have been activated (selected as 1) and therefore it would have been ignored by processing functions). This caused the line: Review#2, 75 ' mean to be registered in the macro, the line which allows it to automatically perform this operation. |
 |
|||||||||
The 'OK' button on Review#3 was then clicked. This caused the panel 'Set up Output for MEAN function' to appear in the Results window. The Results window was suitably re-positioned and re-sized to allow clear view of this panel.
In this analysis, the following were chosen in the 'Set up Output for MEAN function' panel: |
|||||||||
Block number Subject number Event value Mean (average) Bad value count (timer channel) Terminate line after this channel |
|||||||||
This caused the following RFP to be generated: |
|||||||||
select by review# REVIEW#3 output block output subject output event output dat1(03) ' average output dat3(03) ' out-of-range timer value count output ' terminate line in result file end |
|||||||||
The system requested a file name to store the RFP. SMITH2 was entered, the system automatically added the extension .RFP. The system stored the RFP code as plain text in file C:\CPI\SMITH2.RFP. A new macro line was produced: ShowResults@C:\CPI\SMITH2.RFP. This would allow the system to load in the RFP if it were running under control of the macro. The system then produced a prompt saying "Press the OK button of Review#3 again". This message was cancelled by clicking its OK button. The meaning of this message was that the mouse cursor should be moved to somewhere in the body of Review#3, and the left button clicked once to bring that Review back into focus. If that Review had been completely covered by the Results window, the Results window might have to be re-sized to make Review#3 at least partially visible. Alternatively, in Windows 95, an icon for Review#3 would have been found in the task bar, which could have been used to set focus on that Review even if it were completely covered by another window. Having brought Review#3 into focus, the OK button on that Review was then clicked. This generated a new line in the macro: Review#3, 51 ' button 4 OK. Clicking the OK button on Review#3 originally caused the 'Set up Output for MEAN function' panel to appear, because the required RFP code to deal with information from this MEAN window was not found in the RFP. However, with the necessary code in the RFP editor, clicking this OK button now caused the RFP to run. A line of data was produced in the Results area of the Results window: |
|||||||||
1 0 10 883.2367 0 |
|||||||||
The meaning of each field in this line was: Block no 1, Subject no 0, Event category 10 (f1), Mean I.B.I. 883.2367 mS, No of out-of-range values encountered in the timer channel 0. This was the selected information for block no 1. The '>' button on Review#3 was then clicked to move it on to Block no 2, and then the 'OK' button was clicked again, producing a second line of data in the Results window. These actions generated two more lines in the macro: |
|||||||||
Review#3, 53 ' button 3 > Review#3, 51 ' button 4 OK |
|||||||||
At this point, it would have been possible to continue clicking on the '>' and 'OK' buttons of Review#3 for all 30 blocks, generating a new pair of lines in the macro each time. However, an alternative to this was employed. The Record button in the macro window was clicked to turn macro record off. The cursor was placed to the far left of the first of these two lines, remembering that there would be a space at the beginning at each line. The 'enter' key on the keyboard was then pressed creating a gap in the macro text. The words ' For all blocks' was typed into this space, remembering the necessary space at the left. The cursor was then moved to the left position on the line immediately below the last of these two lines, and the words ' Next block' were typed in, again remembering the space. The macro text then appeared thus: |
|||||||||
OpenRawData Review#1,SetBlocks@C:\CPI\SMITH2.BLO Review#2,Process@C:\CPI\SMITH2.PRO Review#2,Process=00100000000000000000000000000000 Review#2, 75 ' mean ShowResults@C:\CPI\SMITH2.RFP Review#3, 51 ' button 4 OK For all blocks Review#3, 53 ' button 3 > Review#3, 51 ' button 4 OK Next block |
|||||||||
An advantage of using ' For all blocks' instead of repeating the actions for each block, in addition to making a smaller macro file, was that the number of blocks need not necessarily be the same for each record. The system will start from block 1 and process all the blocks. The macro was then saved to disk in the name SMITH2, using File, Save macro as. The extension .MAC was automatically added by the system. The Run button on the macro window was then clicked. This caused all the Reviews to be closed, and the first line of the macro to be interpreted, requesting a record name for processing. A file was selected, and the entire analysis automatically ran, generating information for each block in the Results window. File, Save results as. was then selected in the Results window to save this information to disk. Other data files were then processed in the same manner. The entire Results file for this example record was as follows: |
|||||||||
1 0 10 883.2367 0 2 0 10 799.4633 0 3 0 10 764.0983 0 4 0 10 839.41 0 5 0 10 825.8835 16 6 0 10 811.5817 0 7 0 10 822.0767 0 8 0 10 852.085 0 9 0 10 841.2213 17 10 0 10 824.435 0 11 0 20 831.1266 0 12 0 20 825.5217 0 13 0 20 810.1334 0 14 0 20 826.4984 0 15 0 20 817.68 0 16 0 20 794.78 0 17 0 20 804.2267 0 18 0 20 844.2367 0 19 0 20 796.5367 0 20 0 20 793.7749 18 21 0 30 833.535 0 22 0 30 795.0667 0 23 0 30 826.9624 15 24 0 30 793.4 0 25 0 30 785.07 0 26 0 30 772.0634 0 27 0 30 788.95 0 28 0 30 769.5634 0 29 0 30 803.375 0 30 0 30 790.9083 0 |
|||||||||